
nfsd stats explained : /proc/net/rpc/nfsd
Posted on April 17, 2017 • 9 minutes • 1714 words
One of those things I never spend much time on was reading about NFS. There is no need for it, it just kinda works out the box. Most of the time that is. The headache starts when it stops working, or pushes your cluster to a grind. One of the first resources you will find is to check /proc/net/rpc/nfsd. But that does not help you much further, so I recently started monitoring the content. Let’s see what is what.
Getting the information is easy :
cat /proc/net/rpc/nfsd
rc 0 225891120 1142621245
fh 94 0 0 0 0
io 2419795101 674116438
th 16 0 0.000 0.000 0.000 0.000 0.000 0.000 0.000 0.000 0.000 0.000
ra 32 599168798 0 0 0 0 0 0 0 0 0 7053691
net 1369894951 0 1369046785 21585
rpc 1369784542 0 0 0 0
proc2 18 0 0 0 0 0 0 0 0 0 0 0 0 0 0 0 0 0 0
proc3 22 84 253414826 11612033 88162237 147421518 109847 606883959 183127783 11620524 290559 110168 0 11837554 213037 2453880 4605041 36226 12203037 1305364 112 56 20349016
proc4 2 1 548713
proc4ops 59 0 0 0 104291 0 0 0 0 0 218574 3 0 0 0 0 3 0 0 0 0 0 0 548712 0 1 0 330138 0 0 0 0 0 0 0 0 0 0 0 0 0 0 0 0 0 0 0 0 0 0 0 0 0 0 0 0 0 0 0 0
Its a bit much, so let’s go line by line :
RC : Reply Cache
The reply cache is a cache that will temporary store idempotent operations, those are operation that can be repeated multiple times without failing. Think : reading a block over NFS. So when a reply gets lost due to bad connection (or other reasons) NFS does not have to do the operation again (performance gain), and the client does not see an error. While this seems a simple enough cache, the reported data is however a bit complex :
<hits> <misses>   <nocache>
0      225891120  1142621245
- hits : client did not receive a reply and decided to re-transmit its request and the reply was cached. (bad)
- misses : an operation that requires caching (idempotent)
- nocache : non-idempotent operation (rename/delete/…)
This is how reply cache looks like for a busy server : (over the weekend)
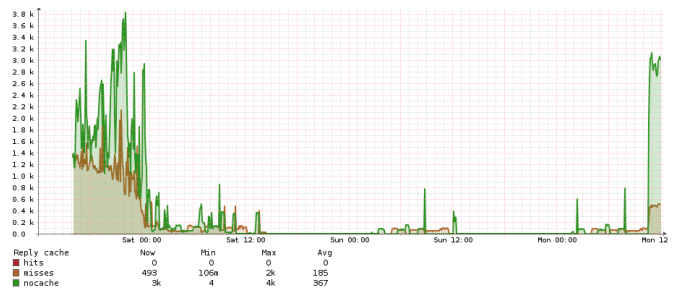
On most servers I monitor I see almost no misses and only nocache, I have not seen any hits so far. Interesting article about the size/use of the reply cache (pdf).
FH : File Handles
File handles are small pieces of memory that keep track of what file is opened; However on all the machines I monitor these are all zero except for the first value stale file handles. Stale file handles happen when a file handle references a location that has been recycled. This also occurs when the server loses connection and applications are still using files that are no longer accessible. All other values are not used.
<stale> <total_lookups>    <anonlookups>  <dirnocache>   <nodirnocache>
94       0                  0              0              0
I believe a large amount of stale files are a bad sign, so far I haven’t seen this happen.
IO : Input Output
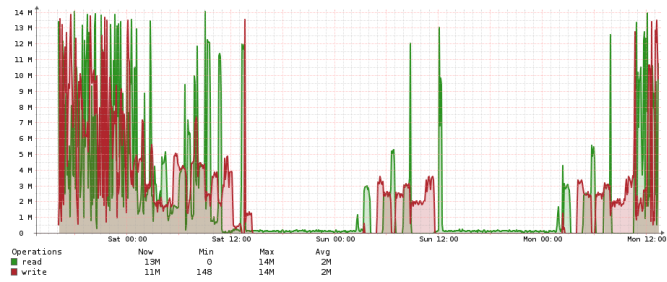
This is simple, it is the total amount of bytes read from disk (raid) and total amount of bytes written to disk since the last restart.
<read>        <write>
2419795101    674116438
Example workload :
TH : Threads
This shows the information on the threads in the “NFS process”; a large part of the values however have been kicked out of the kernel upstream of 2.6.29.
<threads> <fullcnt> <deprecated_histogram>
16         0         0.000 0.000 0.000 0.000 0.000 0.000 0.000 0.000 0.000 0.000
- threads : amount of threads used by the NFS daemon. (this can be increased in /etc/sysconfig/nfs, option RPCNFSDCOUNT)
- fullcnt : amount of times all the NFS threads where used. (most likely deprecated)
For tuning how many threads are needed you could look at : /proc/fs/nfsd/pool_stats, explained here
RA : Read Ahead Cache
Read ahead cache, is a cache that is being used when a sequential blocks are expected to be requested. However I found no explanation saying so, so perhaps I’m wrong. When a certain block is requested as read, the next few blocks have a large chance to be requested as well, so the NFS thread already caches these.
<cachesize> <10%> <..> <100%>            <notfound>
32          599168798 0 0 0 0 0 0 0 0 0  7053691
- cache size : always double of threads (no idea why)
- 10%-100% : histogram of depth the block was found.
- not found : not in read-ahead cache
In real live example : I only see the 10% and the not found increase. With the most being in 10%.
NET : Network
Statistics on network use.
<netcount>   <UDPcount> <TCPcount>  <TCPconnect>
1369894951   0          1369046785  21585
- netcount : count every packet
- UDPcount : count every UDP packet
- TCPcount : count every TCP packet
- TCPconnect : count every TCP connection
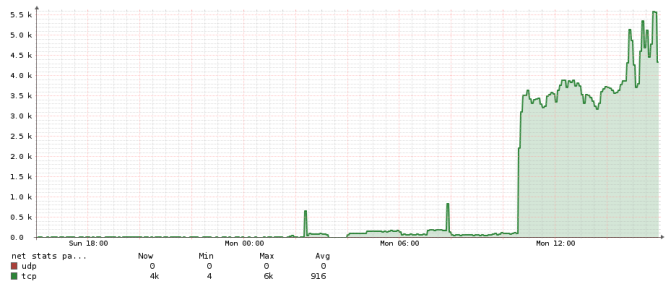
These values depend on how you use NFS (UDP or TCP) and how active the NFS is. The following graph is an example of plotted UDP/TCP over time. Clearly I prefer TCP over UDP connections. (TCP connections should following the line of TCP) Seeing allot of UDP traffic is suspicious, normally NFSv3 will default to TCP, NFSv2 did use UDP.
RPC : remote procedure call
NFS under Linux relies on RPC calls to route requests between client and server.
<count>    <badcnt> <badfmt> <badauth> <badcInt>
1369784542 0        0         0        0
- rpccount : all RPC operations
- badcnt : combined value of next 3, or all bad calls
- badfmt : most bad calls
- badauth : bad authentication
- badcInt : unused
So far I haven’t seen much bad calls.
Proc2
Proc 2 are the stats generated for NFS clients using v2 protocol. This is pretty old (described in 1989) and I could not find a good reason to use these over the v3 or v4 protocols. Except for some tests, I don’t think any current distribution still uses this. In fact in Centos 7 the proc2 line has been dropped totally. (and I assume support also)
The operations however haven’t change that much in v3 protocol, so its still worth looking what they mean.
- The first value indicated how many values are to follow. (18)
- null : do nothing (debug)
- getattr : get file attributes
- setattr : set file attributes
- root : get filesystem root (obsolete)
- lookup : look up file name
- readlink : read from symbolic link
- read : read from file
- wrcache : write to cache (not used)
- write : write to file
- create : create file
- remove : remove file
- rename : rename file
- link : create link to file
- symlink : create symbolic link
- mkdir : create directory
- rmdir : remove directory
- readdir : read from directory
- fsstat : get filesystem attributes
Proc3
Proc 3 are subsequent the stats of v3 protocol stats. This was described in 1995 so its the most commonly used protocol. Its most likely to find decent statistics here. I only describe values that are different from v2 protocol.
- values to follow (22)
- null / getattr / setattr / lookup
- access : check access permission
- readlink / read / write / create / mkdir / symlink
- mknod : create a special device
- remove / rmdir / rename / link / readdir
- readdirplus : extended read from directory
- fsstat : get dynamic file system information
- fsinfo : get static file system information
- pathconf : retrieve POSIX information
- commit : commit cached data to stable storage (server side)
Working NFS server :
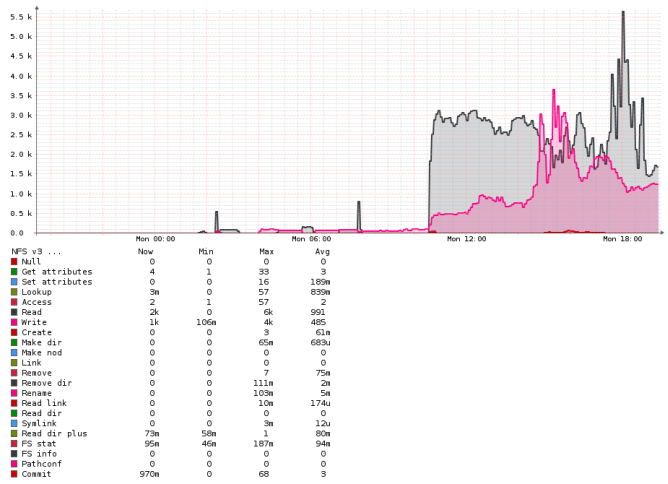
As you see by far most are read/writes. Remarkable allot of commit’s those are called after async writes … (this graph is no database work)
Proc4
Proc 4 is the newest protocol (2000) and one major change is the use of compound. Instead of sending 3 operations to open a file (lookup, open, read), in v4 this can be done in one compound. This means that the line can be shortened to the two types of compounds : null (do nothing) and compound (do something). Since null is only used as debug, a proc4ops are generated.
Proc4ops
These are the operation in v4, once the compound is ‘unpacked’. This is where thinks become really complex, beside the v4 there are also v4.1 and v4.2 extensions to the protocol. You will see between (current) distributions the value count differ pretty big. I found 40, 59 and 71 values in my environment. For my librenms script I used the 59 count. The 40 value’s are v4, the 59 are with v4.1 and the 71 are the v4.2 however you will need to dig into the kernel code to find out to see if the value order hasn’t changed. I assume it hasn’t.
- op0-unused op1-unused op2-future : unused values
- access / close / commit / create
- delegpurge : purge delegations awaiting
recovery - delegreturn : return delegations
- getattr
- getfh : get current file handle
- link
- lock : create lock
- lockt : test for lock
- locku : unlock
- lookup : lookup filename
- lookupp : lookup parent directory
- nverify : verify difference in attributes
- open
- openattr : open named attribute directory
- open_confirm : confirn open
- open_dgrd : reduce open file access
- putfh : set current filehandle
- putpubfh : set public filehandle
- putrootfh : set root filehandle
- read / readdir / readlink / remove / rename
- renew : renew a lease
- restorefh : restore saved filehandle
- savefh : save current filehandle
- secinfo : obtain available security
- setattr
- setcltid : negotiate client id
- setcltidconf : confirm client id
- verify : verify same attributes (see nverify)
- write
- rellockowner : release lock owner (obsolete in v4.1)
For v4.1 see the RFC 5661 and for v4.2 there is only a draft available.
And that’s it… not that I’m an expert now, but at least I know what is happening, based on the charts generated. A while a go we noticed tons of getattr/readdir(plus) calls, and this way we knew some code was looking in a huge (500m+) directory’s.
Source :
- much of the information is originally obtained from a mail archive from _Jordi Prats _who did the initial research, it is copied all over the web, including here, so to those guys from the past, thank!
- NFSv2: RFC1094
- NFSv3: RFC1813
- NFSv4: RFC3010
- NFSv4.1 : RFC5661